Customize dashboards
The dashboard lets you keep track of evaluations and key sales KPIs on an individual or department-specific basis. Use the various dashlets and visual reports to design your own personalized dashboard.
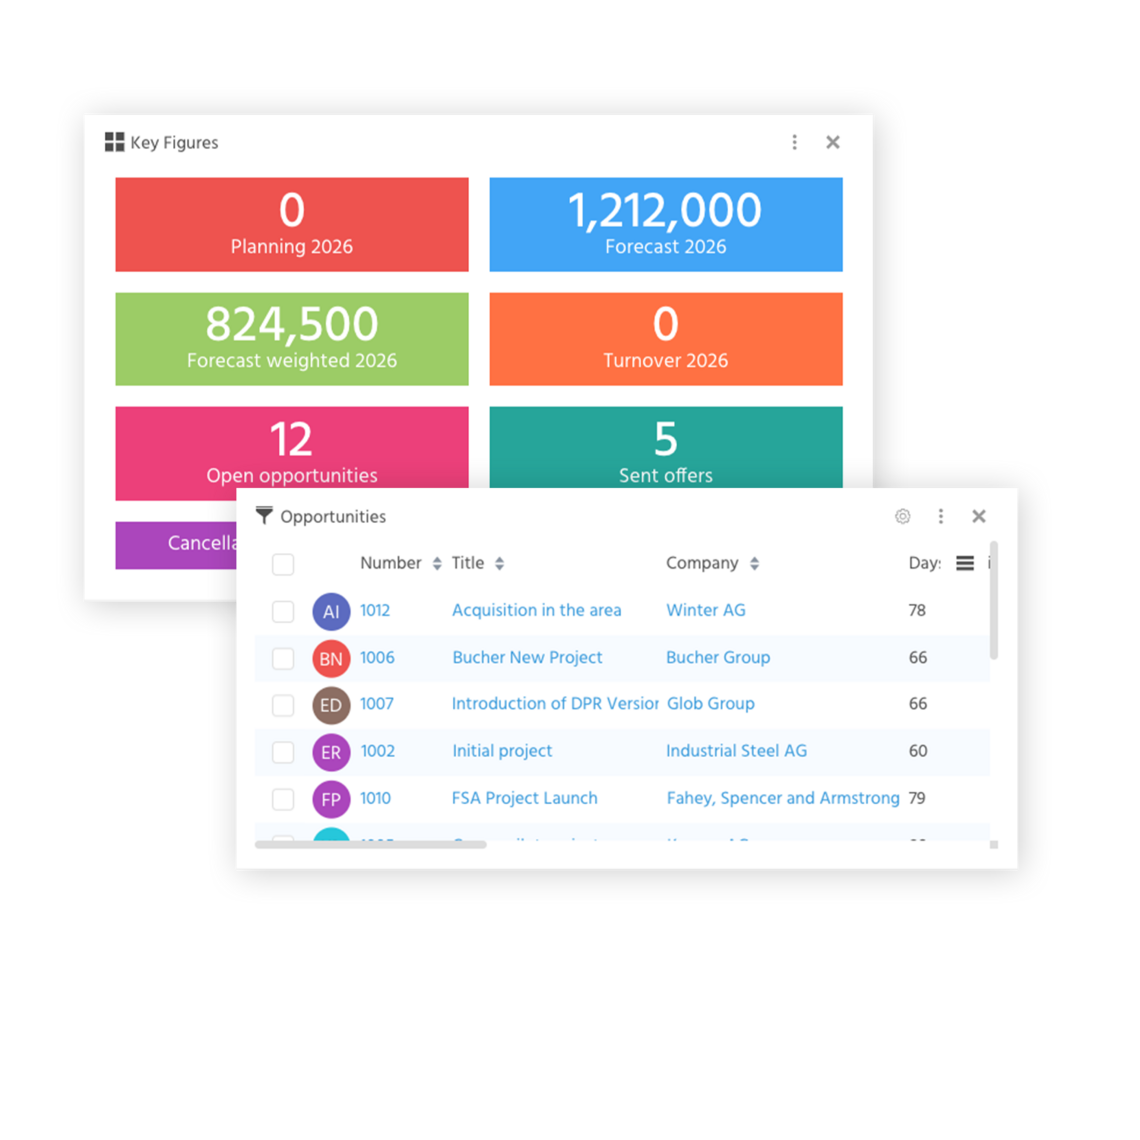
All important business activities at a glance
Your sales dashboard in ADITO CRM gives you insight into all key developments. Get a quick overview of current activities: view current KPIs such as sales, forecasts, conversion rates, and open sales projects, and see at a glance which offers are still pending.
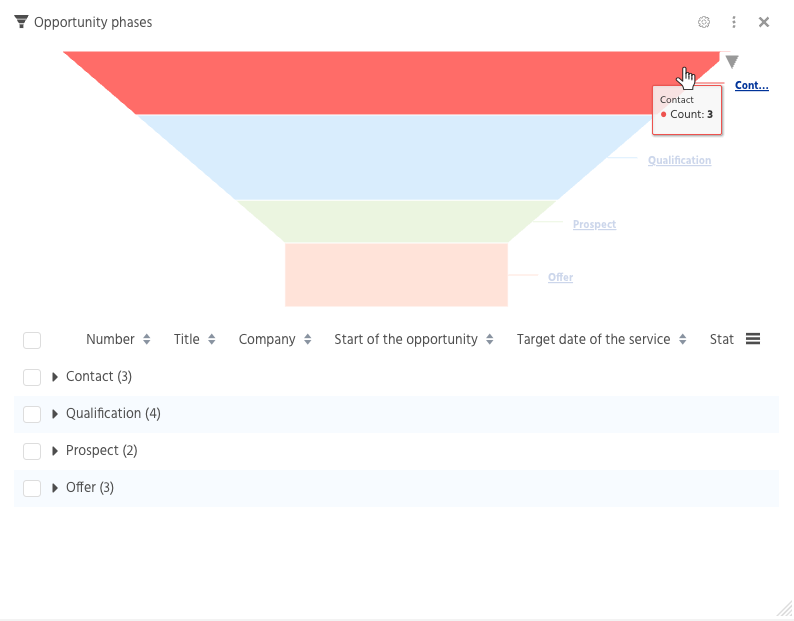
Overview of your leads’ progress
View your current lead pipeline directly on your sales dashboard. ADITO visualizes your sales funnel, allowing you to see at a glance how many leads are currently in each phase. You can also view the conversion rate — the percentage of leads that move from the current stage to the next or are converted into a deal.
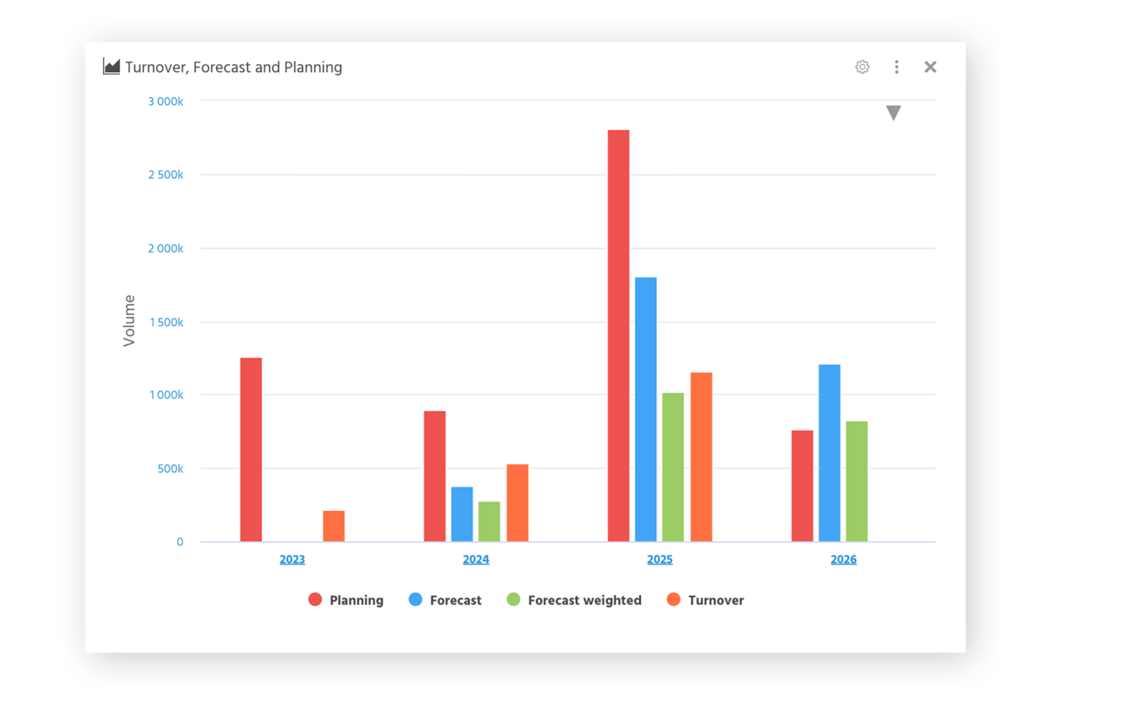
Visualize and monitor sales trends
The dashboard allows you to visually compare your forecast values with actual sales. Quickly and easily analyze sales KPIs both holistically and for individual customers or companies. Compare different time periods or similar projects to uncover optimization potential.